Every freely-traded market makes a series of turning points that tend to occur during the day session of the regional stock market. They can range in number from two to four, but about 80% of the time there are three: HI-LO-HI or LO-HI-LO. The day trader who knows how to spot these turning points has a tremendous advantage. You don’t need to master complex cycle theories or pay to join some elite trading group in order to recognize and utilize daily turning points. I can teach you how to spot them and exploit them with conventional technical analysis.
Scoreboard
ES: 6 wins / 0 losses
Chart Chat
Once again, I’m using a 3-minute chart with the CCI/MACD combo. I have labeled this particular chart template, “TRADING CHAOS” in honor of the book of the same name by Bill Williams. Bill discusses using a trio of moving averages: 34-13-5. Those are the parameters of my RED, WHITE & BLUE MAs on this chart. The ES made a picture-perfect HI-LO-HI configuration. Have a great evening. Be back tomorrow.
Please click on the chart below to make it larger.
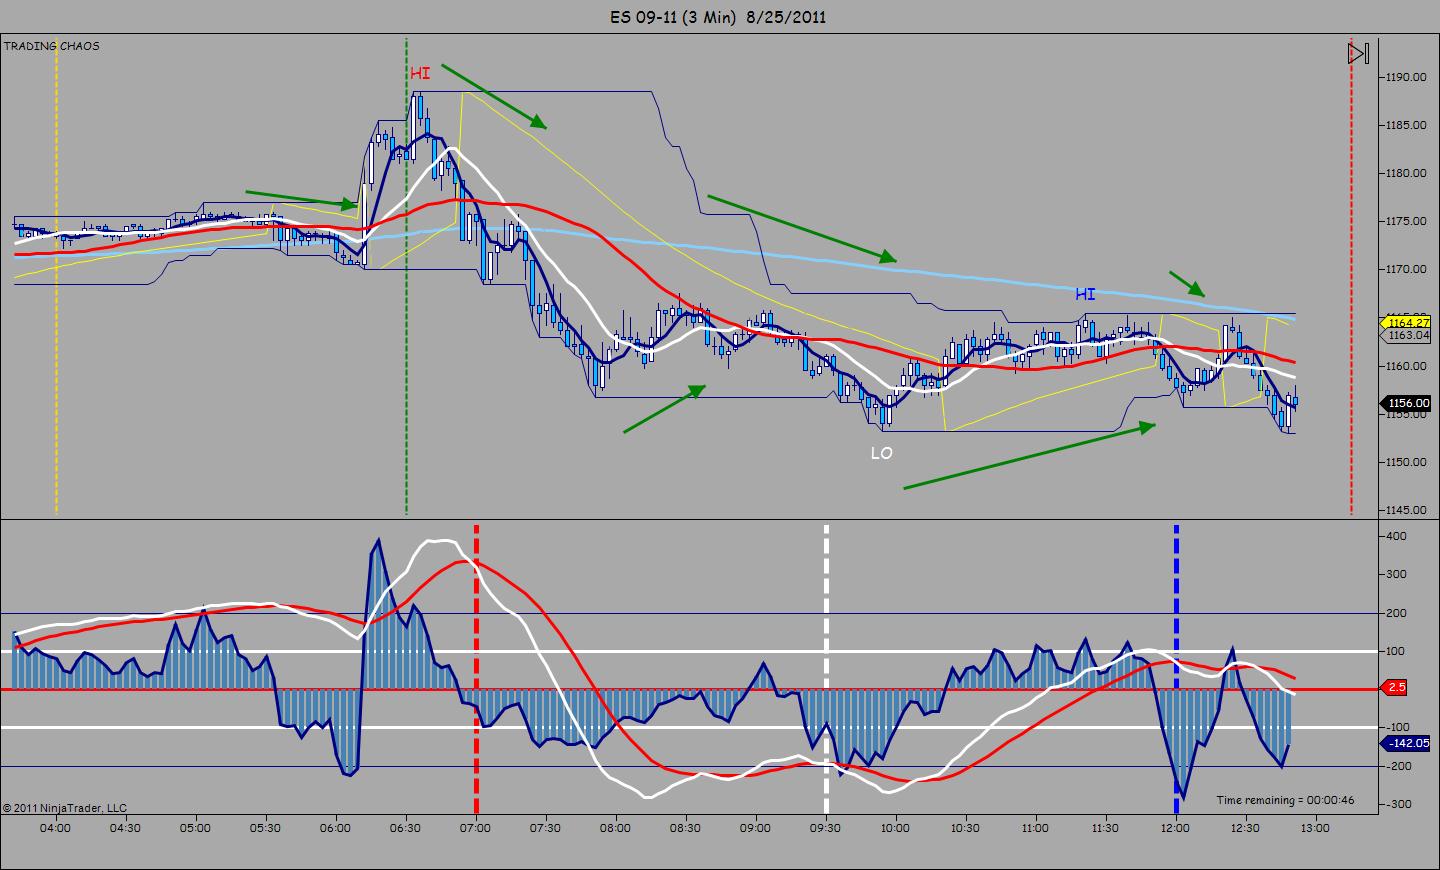
Today’s 3-Minute ES Chart