In this daily blog post I will show you the day trading opportunities presented by the EUR/USD forex pair and the ES futures using 5-minute charts of each market.
Scoreboard
EUR/USD: 5 wins / 0 losses; ES: 7 wins / 0 losses
Chart Chat
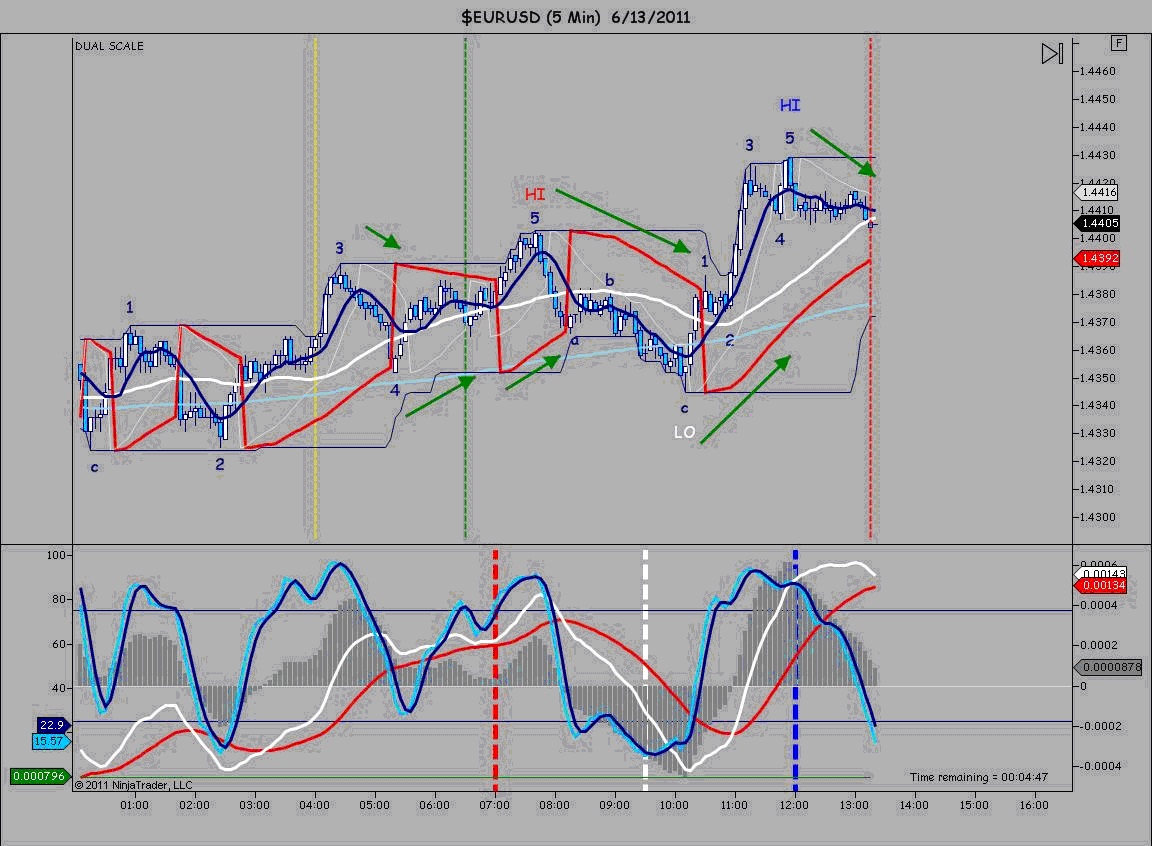
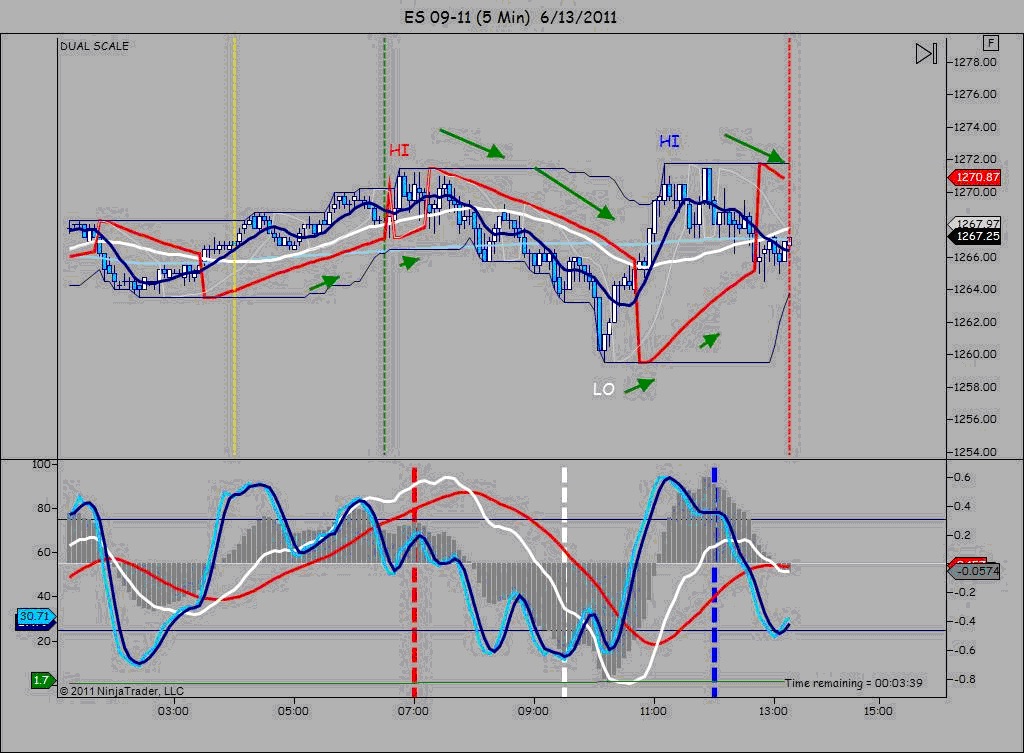
Today, both markets showed well-formed HI-LO-HI turning point patterns within the NYSE day session and very close to their predicted times. On the EUR/USD (Chart #1), I also show my interpretation of today’s Elliott Wave count.
I will be giving a webinar a daily turning points for Global Futures this Thursday, 6/16/11 at 1:30 PST. Here is the link to register:
http://onlinetradercentral.com/presenter_3BT5DA.asp
I will be repeating that same webinar for Pacific Trading on Saturday, 6/18/11, at 9am PST. I will have the registration link for you by tomorrow or Wednesday.
My Technical Toolbox
The upper panel of my charts contains Japanese Candlesticks, Simple Moving Averages, the Parabolic SAR and Donchian Channel. The lower panel contains the MACD (both lines and histogram), and Slow Stochastics. Every parameter of every indicator is a Fibonacci number. Sometimes I use a drawing tool known as the Linear Regression Channel to help me determine when one swing has ended and the next has begun.
How to read the chart notations
Trades are marked with arrows that begin at my entry point and end with the arrowhead even with my exit point. Arrow above candles = short trade. Arrow below candles = long trade. Green arrow = winning trade. Dark Red arrow = losing trade. Yellow arrow = a good trade that I was not able to actually take for some reason.
Regarding the vertical dashed lines in the upper panel of the chart, the GOLD line is at 4am PST when I typically get up. The GREEN line is at 6:30am PST when the NYSE opens. Thus, the space between the gold and green lines represents my personal “premarket.” The RED line is at 1:15pm PST, the daily close for the ES. So, the space between green and red is the basic “day session.”
Regarding the three thicker RED, WHITE & BLUE dashed lines in the lower panel, from left to right they are at 7am, 9:30am and 12pm. These are the approximate times when a reversal of direction might occur.
Daily Turning Points
Every freely-traded market makes a series of predictable turning points during its primary day session. All active markets have between two and four HI/LO turning points. On an average day, there are three: HI/LO/HI or LO/HI/LO. These turning points are consistent with various market cycle theories including Elliott Wave and Welles Wilder’s Delta Phenomenon. These dashed lines remind me to be on the lookout for these points at these approximate times.
Some days, I will also add my interpretation of the Elliott Wave count to one or both charts. Since there is no objective standard in EW, there is no way to know for certain if my wave count is correct. All I can tell you is that I have tried my best to abide by the conventional rules and guidelines of wave counting. You don’t need to be a master of EW to trade my method, but it helps to have a basic understanding of the differences between a with-the-trend impulse wave and a counter-trend corrective wave. Statistically the former tend to be longer and stronger. But, the latter can often provide good trading opportunities provided you realize you are trading against the greater tend and take appropriate precautions.
Please note: you do not need to master complex cycle theories for pay to join some elite trading group in order to recognize and utilize daily turning points. Keep watching my charts each day and you will learn how to spot them and exploit them with conventional technical analysis.
Please click on the charts below to make them larger.